
SAT Sample Statistics and Margin of Error Worksheet
A sample proportion estimates a population proportion; a margin of error gives a range around that estimate. Write the range first, then scale the proportion or its endpoints when asked for a population count.

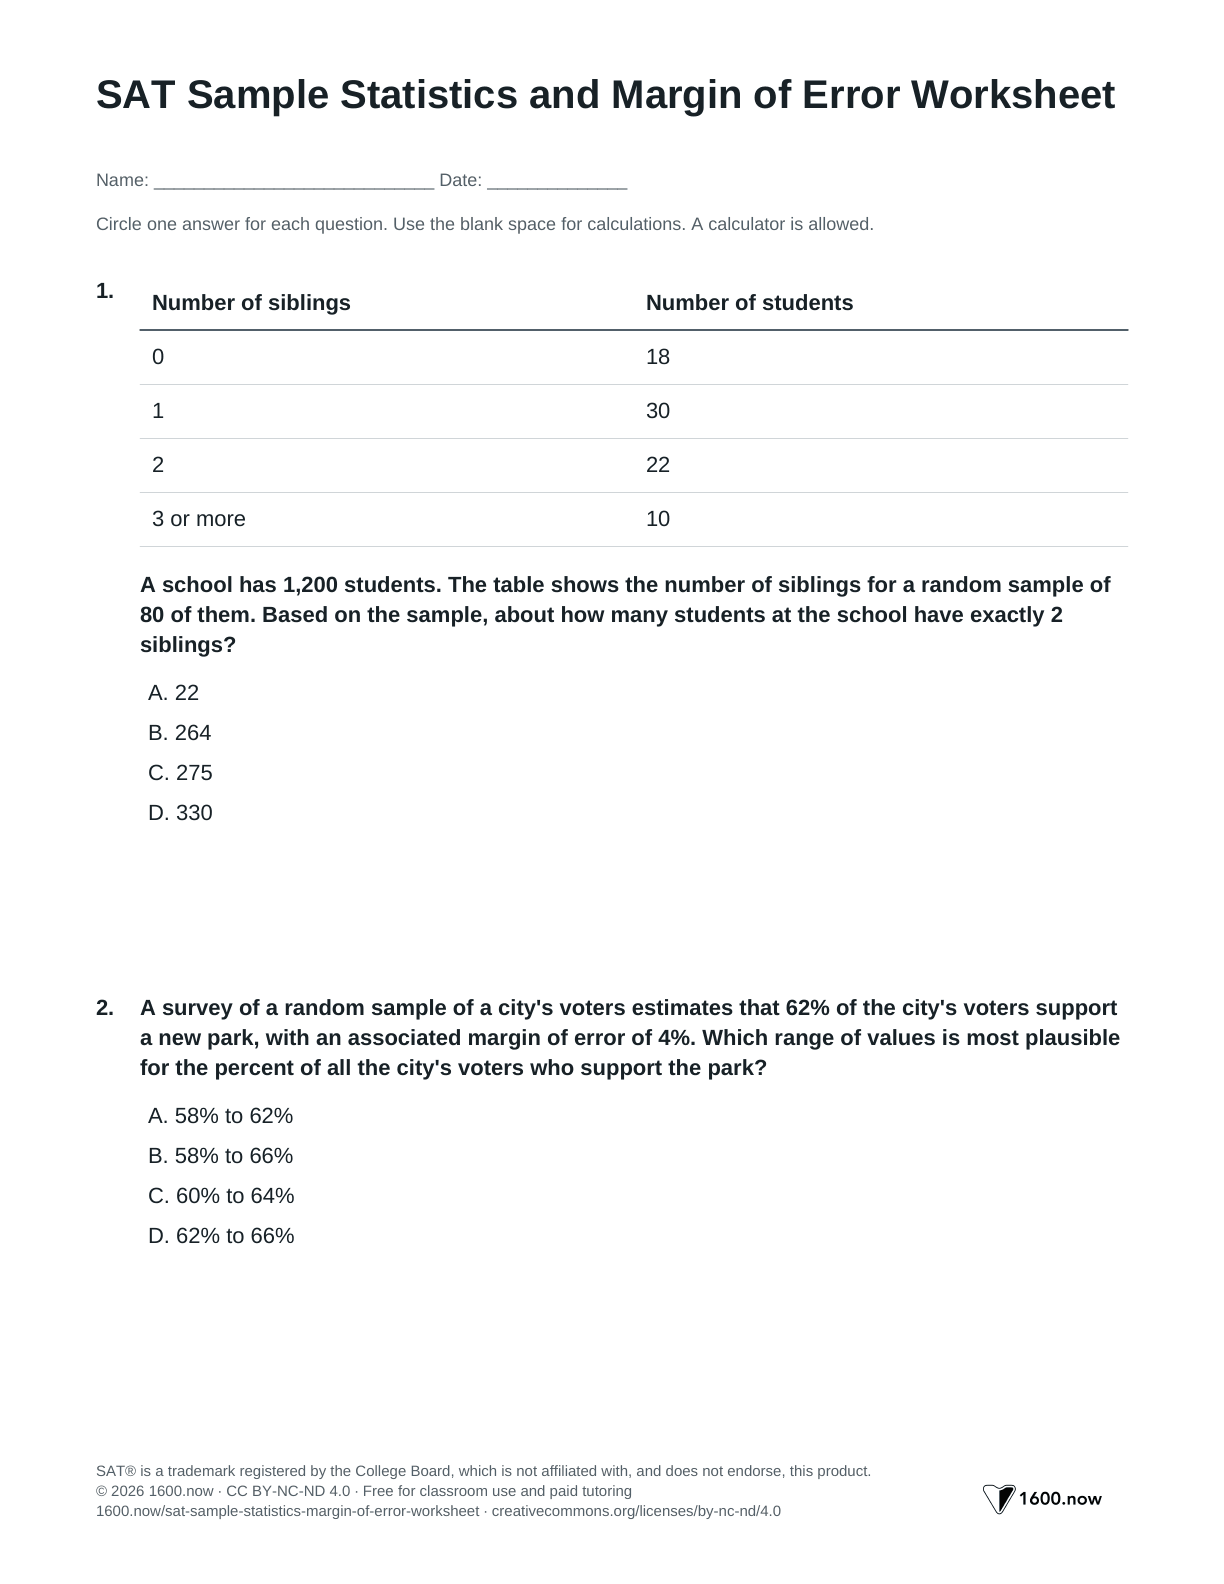
The 12 questions cover random samples, plausible values, population estimates, and comparing survey intervals. Download the student copy or the explained answer-key PDF.
12 questions · about 25 minutes · Problem-Solving and Data Analysis › Inference from sample statistics and margin of error
Share to Google Classroom · This worksheet is free to print and share under CC BY-NC-ND 4.0. Tutors may also use it in paid sessions. If you post it online, please link to this page instead of re-uploading the PDF. These are original questions, not College Board items.
Build the interval before interpreting the estimate
An estimate of 62% with a margin of error of four percentage points gives a reported interval from 58% to 66%. It describes uncertainty about the population proportion, not a rule that every person falls within a range.
For an estimated count, multiply the sample fraction by the population size. A count of 22 out of 80 is , not 22%. For 1,200 students, the estimate is .
Compare entire intervals when evaluating two survey estimates. Overlapping intervals can contain equal values or a reversed ordering, so the estimates alone do not establish which population has the higher proportion. Treat the intervals as the stated plausible ranges, not exact measurements.
Check how the sample was selected. A larger sample can reduce sampling uncertainty, but it does not remove bias caused by selecting an unrepresentative group.
Try it yourself
Choose an answer.
Questions
Question 1
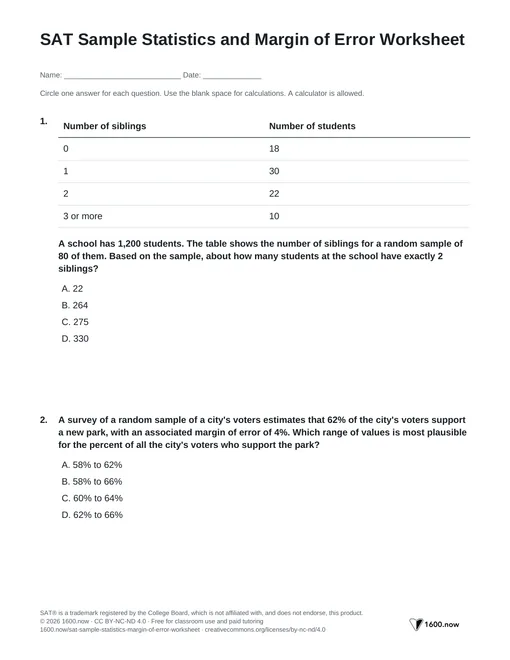
Number of siblings Number of students 0 18 1 30 2 22 3 or more 10 A school has 1,200 students. The table shows the number of siblings for a random sample of 80 of them. Based on the sample, about how many students at the school have exactly 2 siblings?
D. In the sample, 22 of 80 students, or 27.5%, have exactly 2 siblings. For the whole school, that is students. Choice A is the count in the sample only.
Question 2
A survey of a random sample of a city's voters estimates that 62% of the city's voters support a new park, with an associated margin of error of 4%. Which range of values is most plausible for the percent of all the city's voters who support the park?
B. Subtract and add the margin of error: and . Choice C uses half the margin on each side.
Question 3
A researcher plans to survey a random sample of residents to estimate the mean commute time in a town. Which change would most likely reduce the margin of error of the estimate?
A. With random sampling, a larger sample gives an estimate with a smaller margin of error. Choice C gives up random sampling, which can bias the estimate.
Question 4
A principal wants to estimate the percent of the school's 2,400 students who walk to school. Which method will give an estimate that can be applied to all 2,400 students?
A. Only choice A gives every student the same chance of being chosen, so the sample should represent the whole school. The other methods pick groups whose ways of getting to school may differ from the rest of the students.
Question 5
A polling group surveyed a random sample of 300 adults who live in Ohio. Of those surveyed, 41% said they read the news every day. To which group can this result be applied?
B. The sample was chosen at random from adults who live in Ohio, so the estimate applies to that group. It says nothing reliable about adults in other states or about children.
Question 6
A mill selected 60 bags of flour at random and found a mean weight of 5.02 pounds, with an associated margin of error of 0.03 pound. Which value is a plausible mean weight, in pounds, of all bags of flour from the mill?
C. The plausible values run from to pounds. Only 5.00 is in that range.
Question 7
For a random sample of 50 apartments in a city, the mean monthly water use was 4,200 gallons, with an associated margin of error of 250 gallons. Which conclusion is best supported?
B. The margin of error describes the estimate of the mean, not individual apartments. Plausible values for the city's mean are to gallons. Choices A and C are about individual apartments, and choice D ignores the margin of error.
Question 8
A town has 8,000 households. A survey of a random sample of 250 households found that 20% own an electric car, with an associated margin of error of 3%. Which range is most plausible for the number of households in the town that own an electric car?
A. The plausible percents are to . Of 8,000 households, that is to . Choice C treats the 3% as 3 households.
Question 9
A random sample of 1,000 voters in a state found that 55% support a ballot measure, with an associated margin of error of 3%. A news report says that a majority of the state's voters support the measure. Is this claim supported by the survey?
D. The plausible range is to . All of it is above 50%, so the survey supports the claim. Choice C claims more precision than a sample can give.
Question 10
Two towns each surveyed a random sample of residents. In Town A, 48% supported a new library, with an associated margin of error of 4%. In Town B, 53% supported it, with an associated margin of error of 4%. Which conclusion is best supported?
D. Town A's plausible range is 44% to 52%, and Town B's is 49% to 57%. The ranges overlap from 49% to 52%, so the towns' support could be equal, or Town A's could even be higher.
Question 11
An orchard has 900 apple trees. For a random sample of 40 of the trees, the mean number of apples per tree was 210, with an associated margin of error of 15 apples. Which of the following is a plausible value for the total number of apples on all 900 trees?
C. Plausible values for the mean are 195 to 225 apples per tree. For 900 trees, the total is plausibly between and . The estimate is in that range, and 210,000 is not. Choice A counts only the 40 sampled trees.
Question 12
Researchers caught, tagged, and released 150 fish in a lake. Later, they caught a random sample of 200 fish from the lake, and 12 of them were tagged. If the tagged fish mixed evenly with the others, about how many fish are in the lake?
C. In the sample, of the fish were tagged. If the 150 tagged fish are also 6% of the lake's fish, the lake has fish. Choice A counts only the fish the researchers handled.
0/12 correct
Check your margin of error answers
Each row is a wrong answer choice from one of the sheet's problems. Find the one you picked, then run the check in the last column.
| What your answer looked like | What actually happened | Fix it next time |
|---|---|---|
| 264 in problem 1 | 264 is 22% of 1,200. But 22 is a count out of 80 students, not a percent. | Turn the count into a share of the sample first: . Then . |
| 60% to 64% in problem 2 | You split the 4% margin between the two sides. The full margin applies in each direction. | Subtract and add all of it: and , so 58% to 66%. |
| “Every apartment in the sample used between 3,950 and 4,450 gallons per month” in problem 7 | The margin of error describes the estimate of the mean. It says nothing about individual apartments, which can be far from the mean. | Attach the range to the population mean: the city's mean monthly use is plausibly between 3,950 and 4,450 gallons. |
| 1,597 to 1,603 in problem 8 | You treated the 3% margin as 3 households. The margin is a percent, so it has to be converted too. | The plausible range is 17% to 23%. Convert both ends: 17% of 8,000 is 1,360, and 23% of 8,000 is 1,840. |
| 8,400 in problem 11 | counts only the 40 sampled trees. The question asks about all 900. | Multiply the plausible mean by 900: , inside the range from to . |
| 30,000 in problem 12 | leaves out the 12 tagged fish in the second catch. | The tagged share of the sample is . If the 150 tagged fish are 6% of the lake, the lake has fish. |
Worked example: comparing two surveys
Problem 10 compares two towns. Town A reports 48% support with a margin of error of 4%, and Town B reports 53% with the same margin. Build each range first. Town A: and , so 44% to 52%. Town B: 49% to 57%.
The ranges overlap from 49% to 52%. Support could be 50% in both towns, or 52% in Town A and 49% in Town B, so the surveys don't show which town has more support. The choices that name Town B, or say exactly 5% more, treat the two estimates as exact.
Apply the check to fresh questions
On another survey question, calculate both endpoints before reading the choices. If it asks for a total, scale the interval by the population size. Continue with margin-of-error practice.
Review the inference from sample statistics and margin of error method