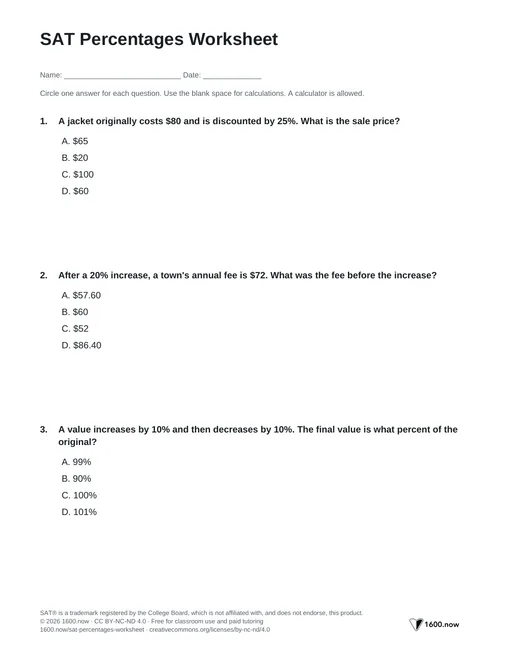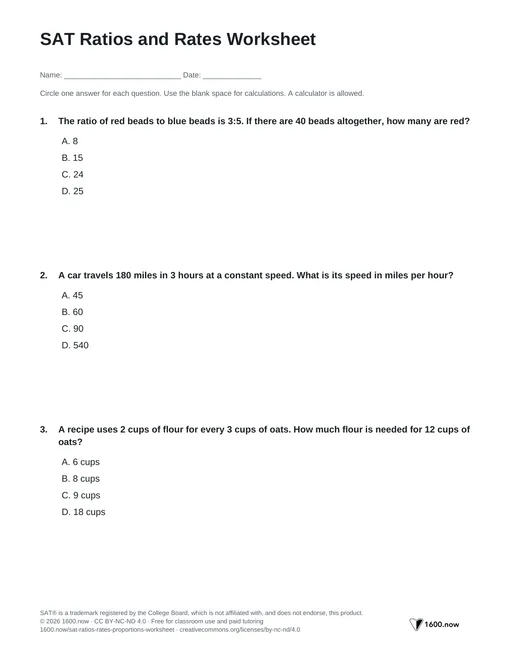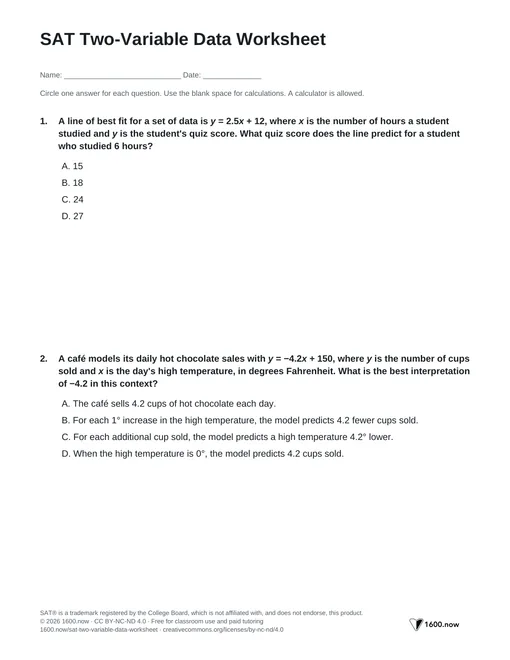

SAT Statistics Worksheet
Mean, median, range, and standard deviation describe different features of a data set. Calculate the requested measure, and use totals when combining groups or solving for a missing value from a mean.

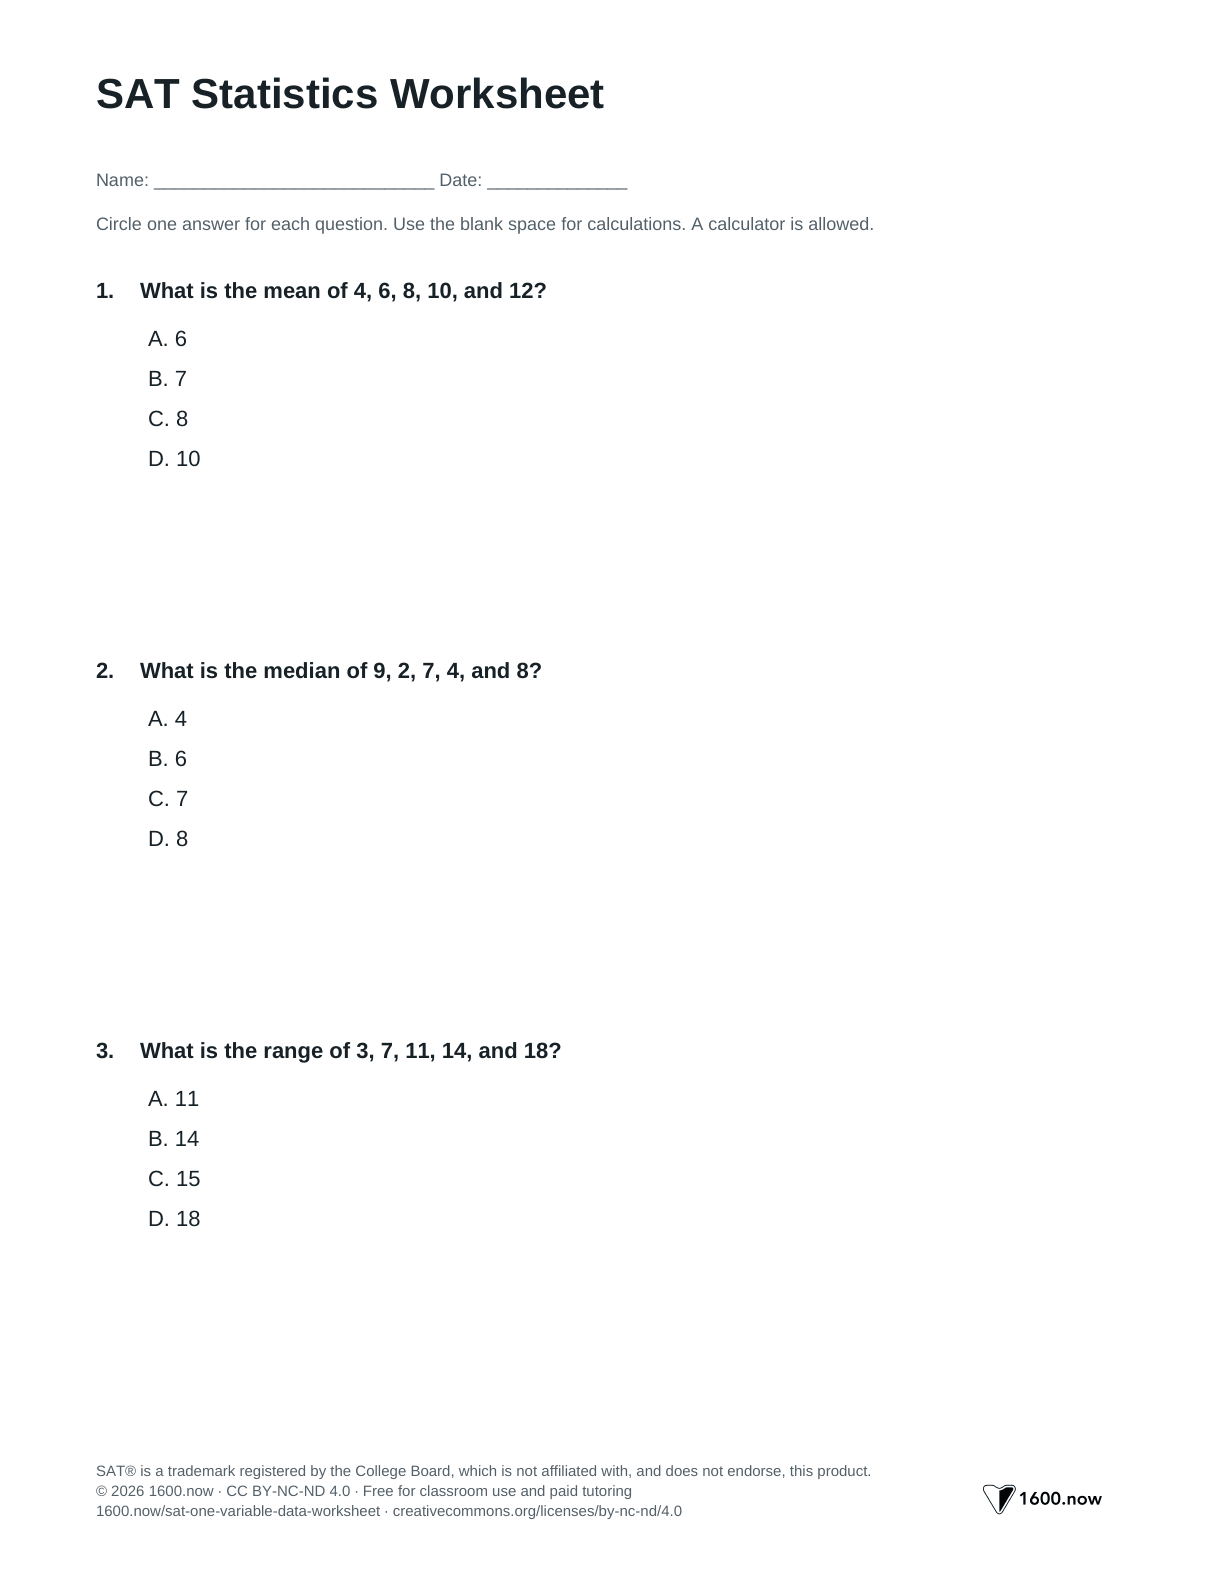
The 12 statistics questions below include changes to data, spread, and weighted averages. Print the student PDF for a first attempt or choose the full version with explanations.
12 questions · about 25 minutes · Problem-Solving and Data Analysis › One-variable data: Distributions and measures of center and spread
Share to Google Classroom · This worksheet is free to print and share under CC BY-NC-ND 4.0. Tutors may also use it in paid sessions. If you post it online, please link to this page instead of re-uploading the PDF. These are original questions, not College Board items.
Use totals for means and positions for medians
The mean is the sum divided by the number of values. Reversing that gives total mean times count. If four values have mean 12, their sum is ; adding a value of 22 makes the new mean .
For the median, sort first. Take the middle value for an odd count or the mean of the two middle values for an even count. An extreme value can change the mean greatly while leaving the middle position unchanged.
Adding the same constant to every value shifts the mean and median but leaves spread unchanged. Multiplying every value by a positive factor multiplies the mean, median, range, and standard deviation by that factor. For a negative factor, the standard deviation and range scale by its absolute value.
For combined groups, add their totals and divide by the combined count. Averaging two group means gives the correct combined mean only when the group sizes are equal.
Try it yourself
Choose an answer.
Questions
Question 1
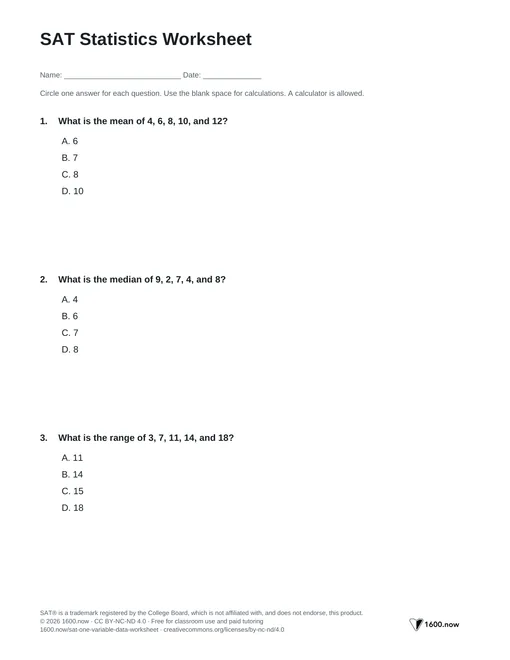
What is the mean of 4, 6, 8, 10, and 12?
C. The sum is 40 and there are 5 values. Dividing 40 by 5 gives a mean of 8.
Question 2
What is the median of 9, 2, 7, 4, and 8?
C. Sort the values as 2, 4, 7, 8, 9. The middle value is 7.
Question 3
What is the range of 3, 7, 11, 14, and 18?
C. Range is maximum minus minimum. Here .
Question 4
Four numbers have a mean of 12. A fifth number, 22, is added. What is the new mean?
B. The original sum is . The new sum is 70 across 5 numbers, giving mean .
Question 5
Each value in a data set is increased by 7. How does the mean change?
C. Adding the same constant to every observation adds that constant to the mean. It does not multiply the mean.
Question 6
Set A is 5, 5, 5, 5. Set B is 2, 4, 6, 8. Which statement is true?
C. Both means are 5. Set A has no spread and standard deviation zero, while B has values at several distances from 5.
Question 7
Score Frequency 2 1 3 2 4 1 The table gives test scores and their frequencies. What is the mean score?
C. The weighted total is . There are 4 observations, so the mean is .
Question 8
What is the median of 1, 3, 5, 7, 9, and 11?
B. With six sorted values, average the third and fourth: .
Question 9
In the data set 10, 11, 12, 13, 14, the value 14 is replaced by 100. What happens to the median?
B. The replacement changes the largest value but leaves the sorted middle value, 12, unchanged. The mean does change.
Question 10
A data set has mean 20. Every value is multiplied by 3. What is the new mean?
D. Multiplying every observation by 3 also multiplies their sum by 3 without changing their count. The mean becomes .
Question 11
Five values have sum 65. Four of them are 8, 10, 12, and 15. What is the fifth value?
D. The four known values sum to 45. Subtracting 45 from the total 65 gives the missing value, 20.
Question 12
Two classes have 10 and 20 students, respectively. Their mean quiz scores are 80 and 95. What is the combined mean score?
C. The combined score total is . Divide by 30 students to get 90, using a weighted mean.
0/12 correct
Check your statistics answers
Each row is a wrong answer choice from one of the sheet's problems. Find the one you picked, then run the check in the last column.
| What your answer looked like | What actually happened | Fix it next time |
|---|---|---|
| 6 in problem 2 | 6 is the mean, . The question asks for the median. | Sort the values, 2, 4, 7, 8, 9, and take the middle one: 7. |
| 17 in problem 4 | You averaged the old mean, 12, with the new value, 22, as if each counted once. The 12 stands for four values. | Use totals: , plus 22 is 70, and . |
| 5 or 7 in problem 8 | With six values there's no single middle value. 5 and 7 are the two middle values. | Average them: . |
| “It increases to 29.2” in problem 9 | 29.2 is the new mean, . The median depends only on the middle value. | Sort the new set, 10, 11, 12, 13, 100. The middle value is still 12. |
| 23 in problem 10 | You added 3 to the mean. Every value was multiplied by 3, so the mean is multiplied by 3. | . Check with a small set: 10 and 30 have a mean of 20, and 30 and 90 have a mean of 60. |
| 13 in problem 11 | 13 is the mean of the five values, . The question asks for the missing value. | Subtract the known values from the total: . |
Worked example: combining two class averages
Problem 12 gives two classes: 10 students with a mean score of 80 and 20 students with a mean score of 95. Averaging 80 and 95 gives 87.5, which treats the classes as the same size. Use totals instead. The first class scored points and the second scored .
Together that's 2,700 points for 30 students, so the combined mean is . Check where it lands: 90 is 10 above 80 and 5 below 95. The larger class has twice as many students, so the combined mean sits twice as close to its average.
Apply the check to fresh questions
For another statistics question, write the requested measure before calculating. Use total-and-count work for means and a sorted list for medians, then continue through the practice link.
Review the one-variable data: distributions and measures method