
SAT Evaluating Statistical Claims Worksheet
Random selection and random assignment answer different questions. Random selection supports generalizing to the sampled population; random assignment supports a causal comparison between treatments in a suitably controlled experiment.

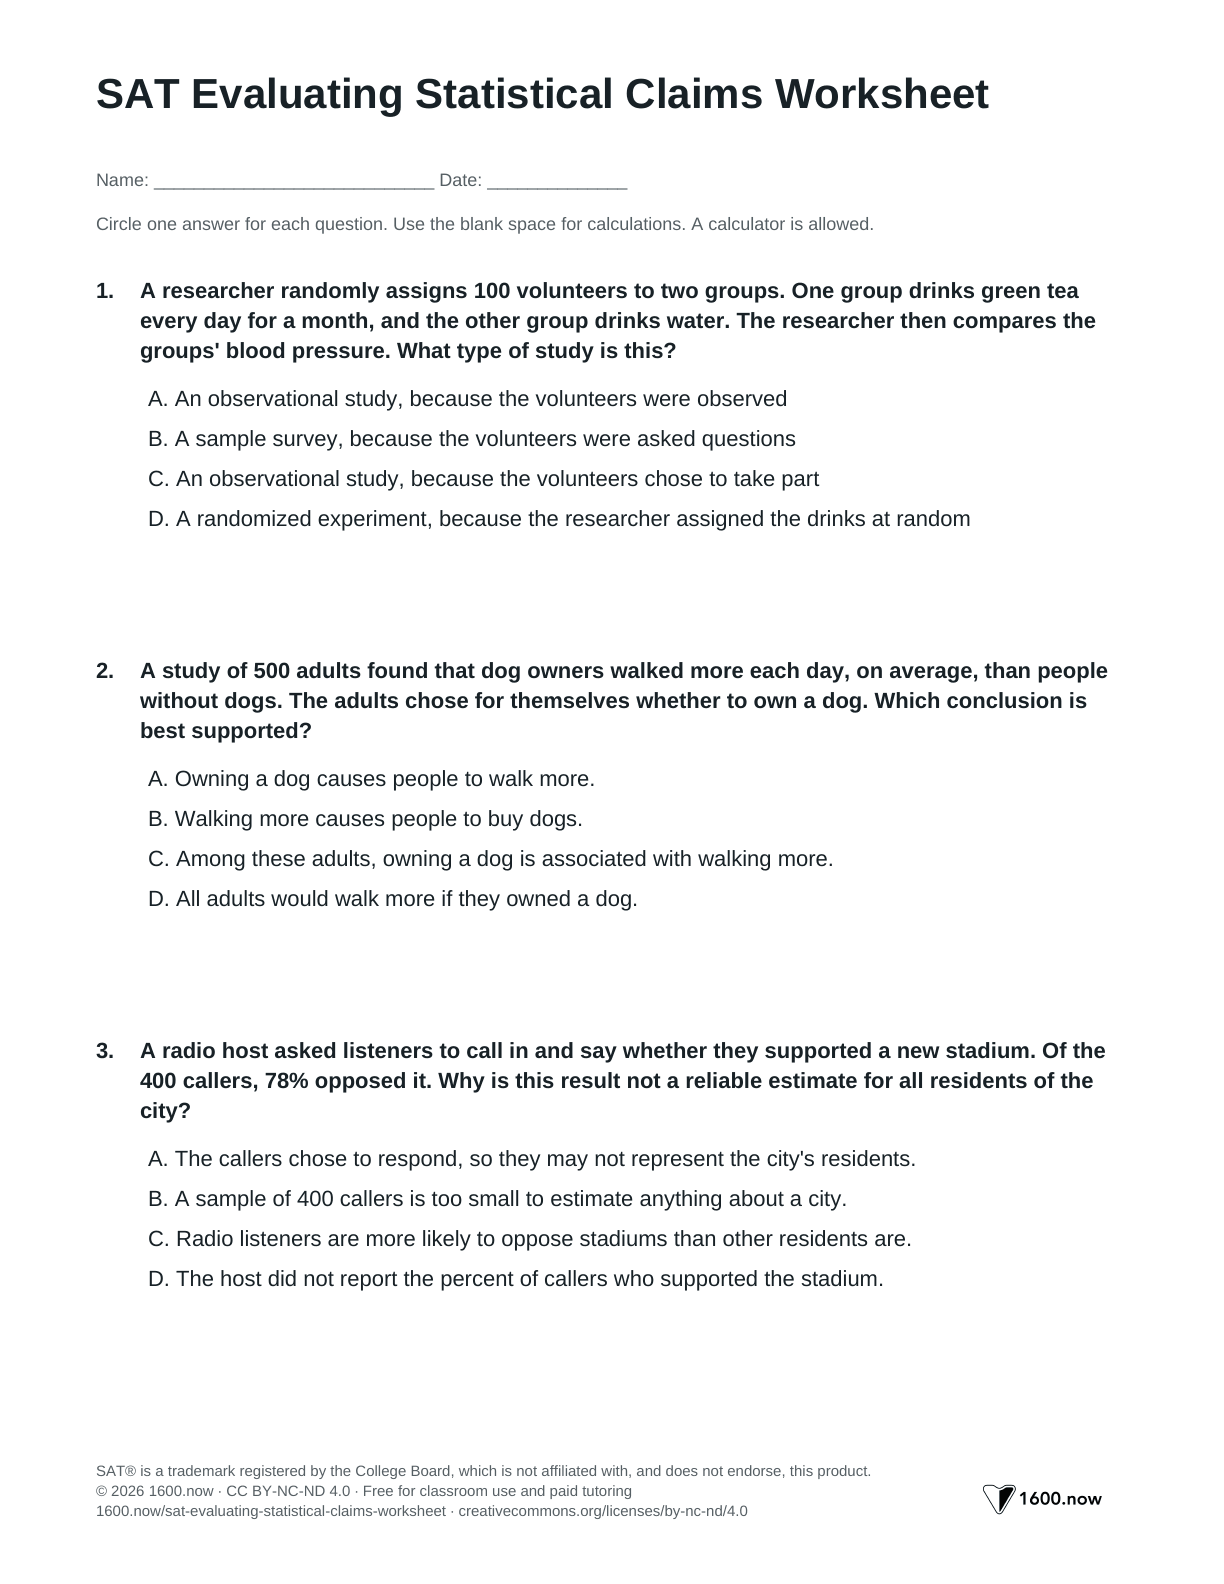
The 12 questions below ask what experiments, surveys, and observational studies can justify. Print the student worksheet or use the full PDF for explained answers.
12 questions · about 25 minutes · Problem-Solving and Data Analysis › Evaluating statistical claims: Observational studies and experiments
Share to Google Classroom · This worksheet is free to print and share under CC BY-NC-ND 4.0. Tutors may also use it in paid sessions. If you post it online, please link to this page instead of re-uploading the PDF. These are original questions, not College Board items.
Check selection, assignment, and the claim’s scope
Ask who entered the study and how. A random sample from a city supports conclusions about that city. Volunteers or callers to a radio show may differ from the wider population, even when the group is large.
Next ask how treatment was determined. If subjects chose their own treatment, an observed difference may reflect other differences between them. If researchers assigned treatment at random, the comparison can support cause and effect; the population scope still depends on who was studied.
Keep average effects and individual effects separate. A higher group mean does not establish that every participant improved by the same amount. Match the conclusion’s population, metric, and strength to the design.
An observational study can support an association even when it cannot establish a cause. Do not discard an association simply because the study was not an experiment.
Try it yourself
Choose an answer.
Questions
Question 1
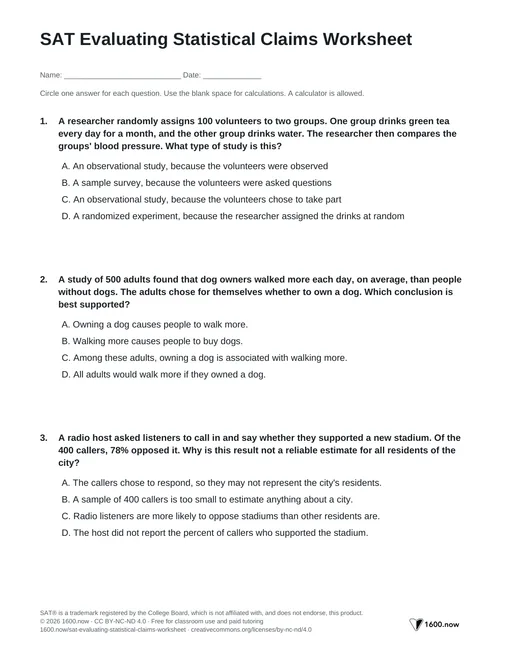
A researcher randomly assigns 100 volunteers to two groups. One group drinks green tea every day for a month, and the other group drinks water. The researcher then compares the groups' blood pressure. What type of study is this?
D. The researcher decided at random who drank tea and who drank water. Assigning a treatment at random makes this an experiment, even though the participants were volunteers.
Question 2
A study of 500 adults found that dog owners walked more each day, on average, than people without dogs. The adults chose for themselves whether to own a dog. Which conclusion is best supported?
C. Nobody was assigned to own a dog, so this is an observational study. It can show an association but not a cause; people who already liked walking may have been more likely to get dogs.
Question 3
A radio host asked listeners to call in and say whether they supported a new stadium. Of the 400 callers, 78% opposed it. Why is this result not a reliable estimate for all residents of the city?
A. Only that show's listeners could call, and the ones who did chose to. A self-selected sample can't be assumed to represent all residents. Choice C may or may not be true; nothing in the survey shows it.
Question 4
To estimate the mean number of hours that students at a high school spend on homework each week, a teacher surveys the 28 students in her advanced calculus class. Why might this estimate be biased?
D. The sample comes from one advanced class, not from all students at the school. Those students may have more or less homework than the school's typical student. Surveying more students from the same class, or a random few of them, would not fix that.
Question 5
Across 50 towns, the number of public libraries is positively associated with the number of car thefts. Which is the most likely explanation?
B. Population affects both counts: a larger town tends to have more libraries and more thefts. The association doesn't show that either one causes the other.
Question 6
Researchers surveyed a random sample of 1,000 adults in a state. Adults who reported sleeping more hours reported lower stress levels, on average. Which conclusion is best supported?
A. The random sample lets the association apply to all adults in the state. But the researchers didn't assign anyone an amount of sleep, so the study can't show that sleep causes lower stress.
Question 7
A gym asked its members for volunteers and randomly assigned 60 volunteers to either a new workout plan or the standard plan. After 8 weeks, the new-plan group had a greater mean increase in strength. Which conclusion is best supported?
C. Random assignment supports a cause-and-effect conclusion. The volunteers weren't selected at random from the gym's members, so the result applies only to people like those in the study. Choice D confuses random assignment with random selection.
Question 8
A company wants to find out whether a new feature in its app increases the time users spend in the app. Which study design would best allow the company to conclude that the feature causes a change?
B. Random assignment makes the two groups alike except for the feature, so a difference in time can be credited to the feature. In choice A, users who turn the feature on may already use the app more.
Question 9
Group Number of plants Mean yield (kilograms) Fertilizer X 60 4.8 No fertilizer 60 3.9 A researcher randomly assigned 120 tomato plants in a greenhouse to two groups of 60. One group received fertilizer X, and the other received no fertilizer. The table shows the results. Which conclusion is best supported?
D. The plants were randomly assigned, so the fertilizer can be credited with the greater mean yield, kilogram more. That is a difference in means, not a gain for every plant (choice A), and it applies only to plants like the ones studied (choice C).
Question 10
A researcher selected 200 students at random from a university. Half were randomly assigned to study with flashcards and half to reread their notes. The flashcard group had a higher mean score on a vocabulary test. Which conclusion is best supported?
A. Random selection from the university lets the result apply to its students, and random assignment supports a cause. The study sampled only one university, so it doesn't cover all college students (choice B), and a higher mean doesn't mean every student would improve (choice D).
Question 11
A school district mailed a survey to 1,000 randomly selected parents. Only 150 parents returned it, and 90% of them approved of a new school schedule. What is the main problem with using this result to estimate the percent of all parents in the district who approve?
C. The 1,000 parents were chosen at random, but only 15% answered. The parents who took the time to respond may feel differently about the schedule than the 850 who didn't, so the 90% may not reflect all parents.
Question 12
A random sample of 400 juniors at a large high school was studied. The juniors who chose to take a test-prep course had a higher mean score on the state math test than the juniors who didn't. Which conclusion is best supported?
B. The random sample lets the association apply to juniors at the school. But students chose whether to take the course, and those students may differ in other ways, such as how much they studied, so the study can't show that the course caused the higher scores.
0/12 correct
Check your statistical claims answers
Each row is a wrong answer choice from one of the sheet's problems. Find the one you picked, then run the check in the last column.
| What your answer looked like | What actually happened | Fix it next time |
|---|---|---|
| “An observational study, because the volunteers were observed” in problem 1 | Every study observes its subjects. This one is an experiment because the researcher assigned the drinks at random. | Ask who chose the treatment. If the researcher did, at random, it's a randomized experiment. |
| “Owning a dog causes people to walk more” in problem 2 | The adults chose whether to own a dog, so dog owners may differ in other ways, such as already liking to walk. | Without random assignment, claim an association only. Problem 12 is the same case: students chose the course, so the supported answer says the course is associated with higher scores. |
| “A sample of 400 callers is too small to estimate anything about a city” in problem 3 | Size isn't the problem. The callers chose to respond, and people who call a radio show about a stadium may feel differently from other residents. | Check how the sample was chosen before you check its size. A self-selected sample can't stand in for the whole city. |
| “No conclusion can be drawn about adults in the state, because the study was not an experiment” in problem 6 | An observational study can still show an association, and the random sample lets that association apply to adults in the state. | Match the conclusion to the design. A random sample with no assignment supports an association among adults in the state. |
| “Fertilizer X increases the yield of every tomato plant by 0.9 kilogram” in problem 9 | 0.9 kilogram is the difference between the two groups' mean yields. A difference in means doesn't tell you what happened to each plant. | Keep the claim about the mean: fertilizer X caused a greater mean yield for plants like those in the study. |
| “For all college students, studying with flashcards causes higher mean vocabulary scores than rereading notes” in problem 10 | The students were selected from one university, so the result covers students at that university. | Name the population the sample was drawn from, and stop there: students at the university. |
Worked example: random assignment without random selection
Problem 7 describes a gym that asked its members for volunteers and randomly assigned 60 of them to a new workout plan or the standard plan. The new-plan group gained more strength. Ask the two questions. Who chose each person's plan? The researchers did, at random, so the study supports cause and effect.
Who was studied? Volunteers, not a random sample of the gym's members, so the result applies to the volunteers. The supported choice says the new plan caused a greater increase in strength for the volunteers in the study. Extending it to all adults or all members goes past the sample, and saying no cause can be shown mixes up random assignment with random selection.
Apply the check to fresh questions
For your next study-design question, write selection and assignment as separate notes. Then match the answer’s causal language and population to those notes in statistical-claims practice.
Review the evaluating statistical claims method