

Math
Desmos SAT Shortcuts
The SAT Desmos shortcuts worth learning are a small set of entries: graph two equations, evaluate a function, inspect a root or vertex, and fit the model named in a data question. Practice the keystroke and the answer check together.

When Desmos is faster than algebra
Reach for Desmos when the problem asks for a solution, intersection, maximum, minimum, function value, model, or answer-choice test. Those are calculator-native tasks.
Stay on paper when the question is one arithmetic step, a direct formula substitution, or a concept check where opening the calculator adds time.
| Question signal | Desmos move | What to read |
|---|---|---|
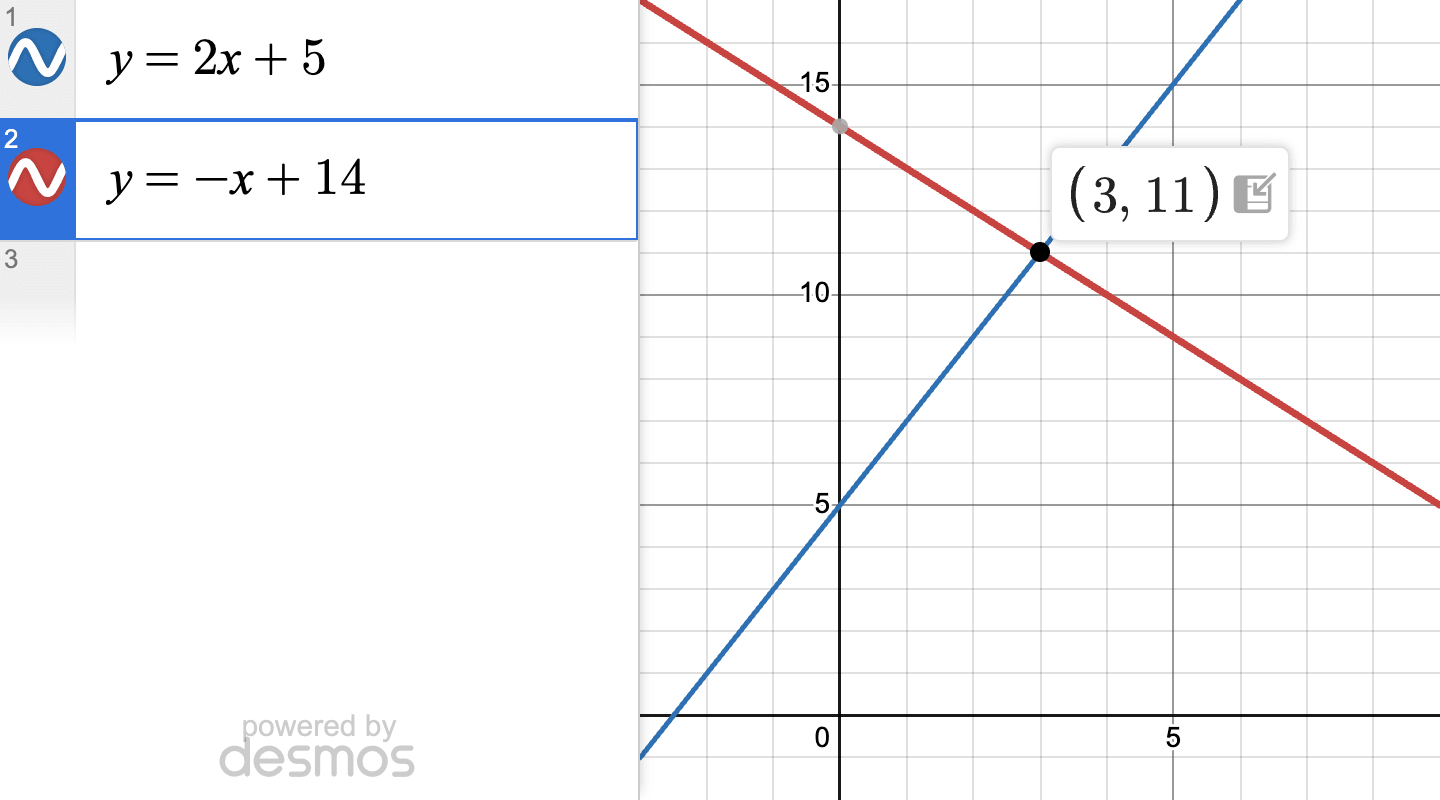
| Two equations | Graph both lines or curves | Intersection coordinates |
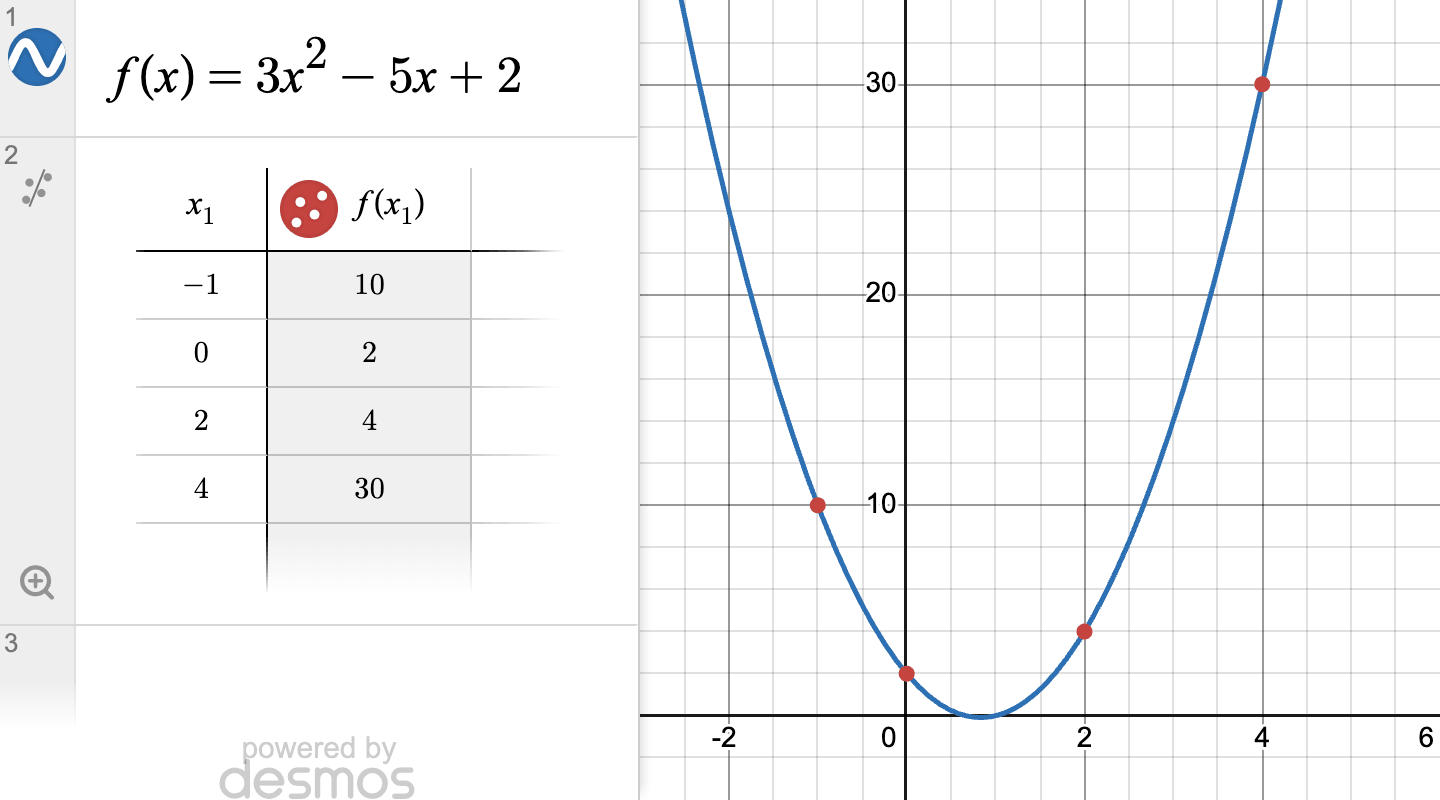
| f(a) or a table of values | Type the function and open a table | Output value at the requested input |
| Quadratic roots | Graph y = expression | x-intercepts |
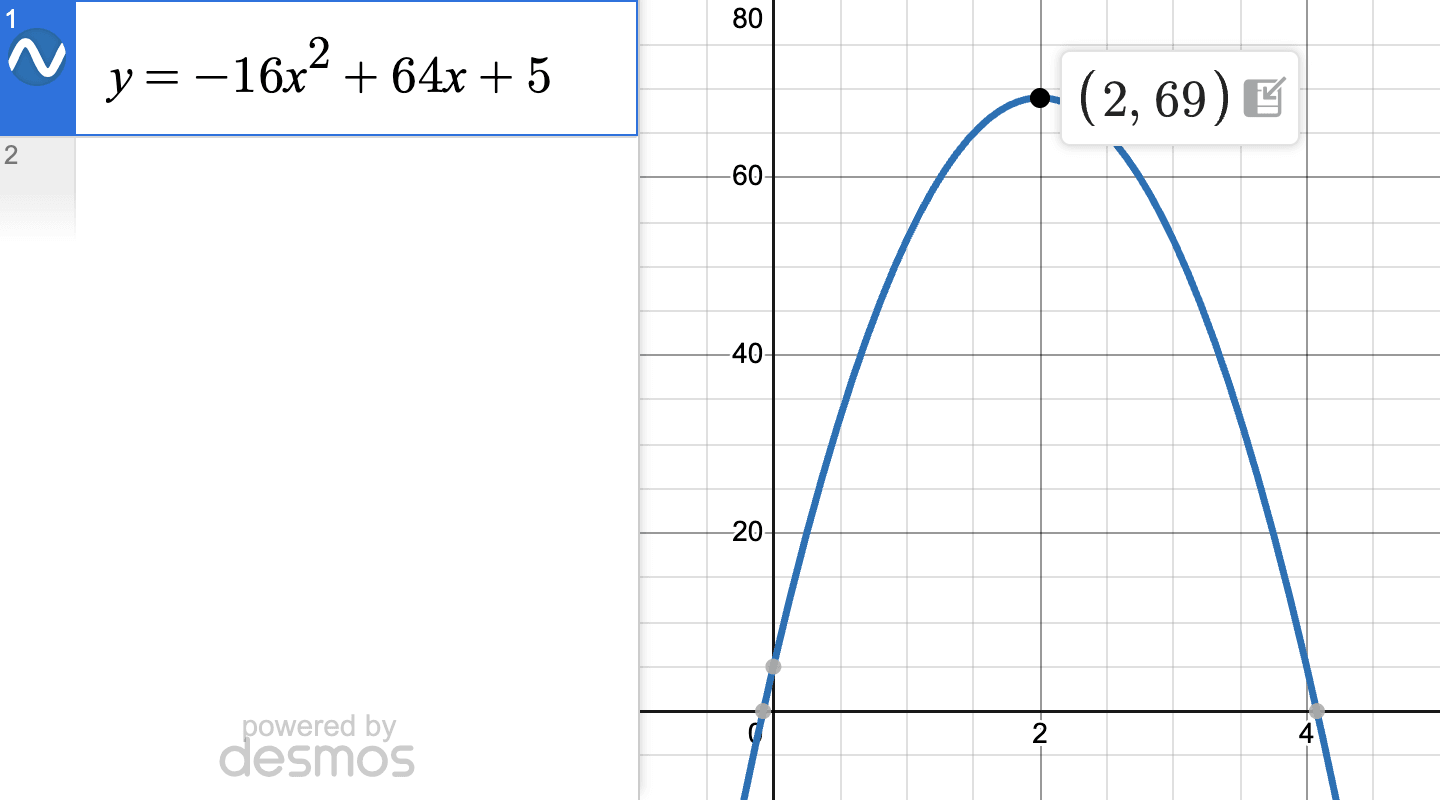
| Maximum or minimum | Graph the function | Vertex y-value or x-value |
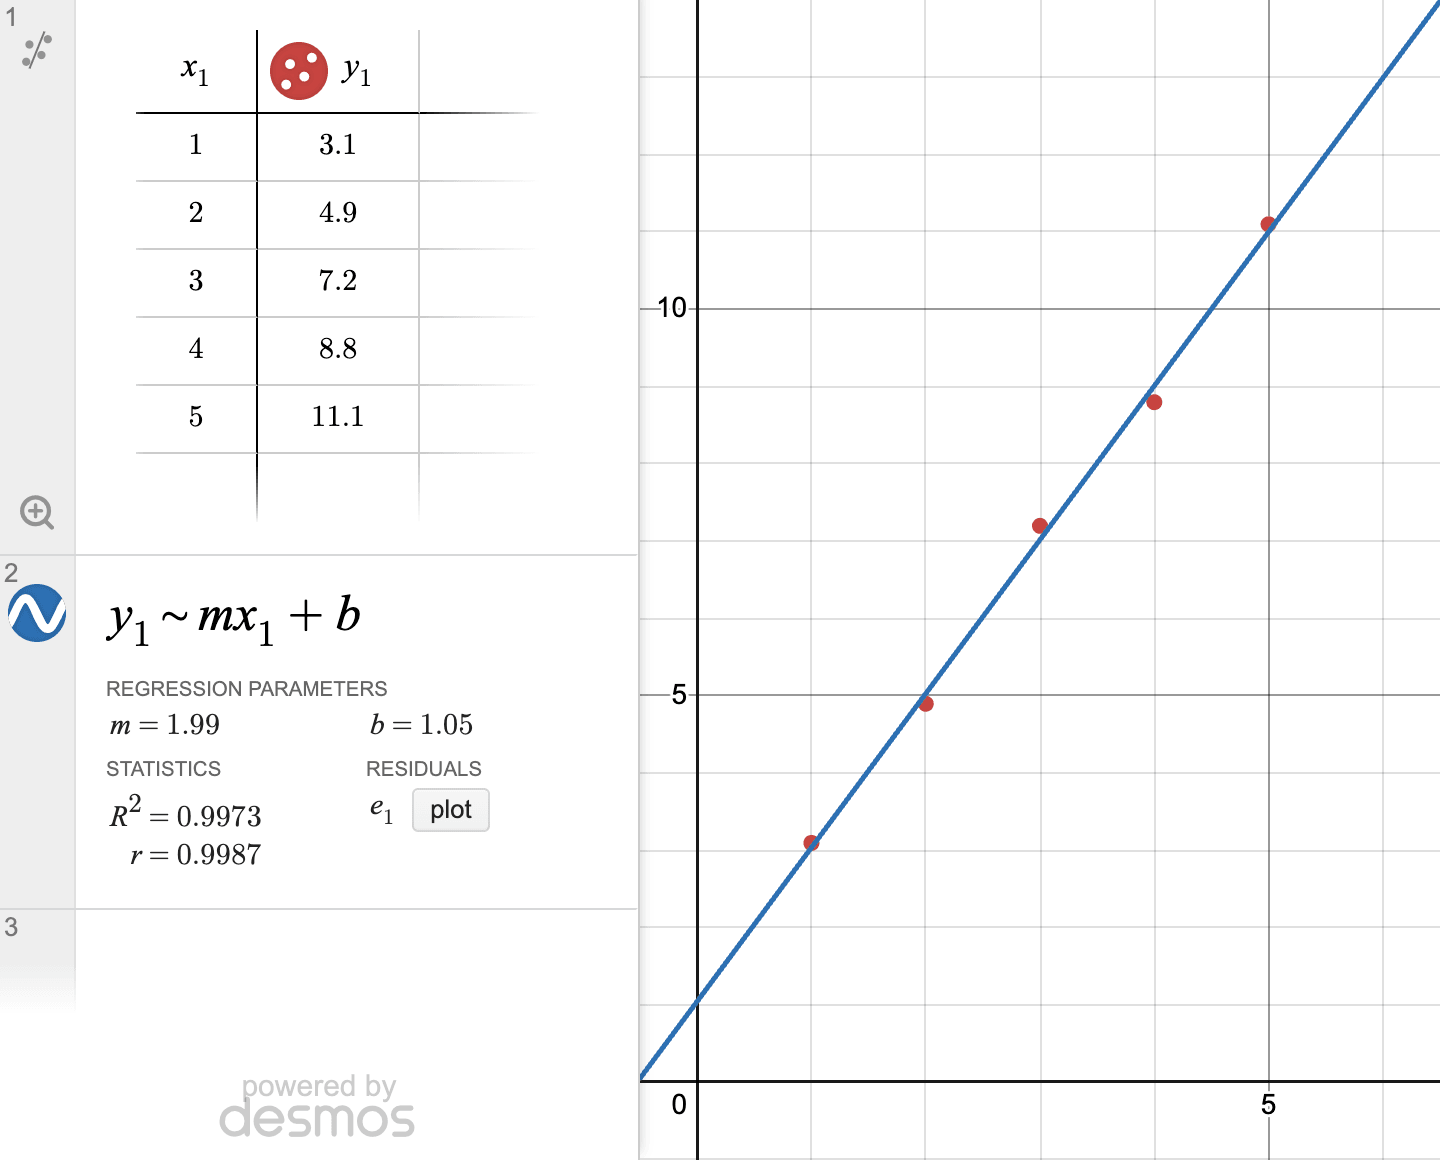
| Scatterplot or data table | Enter points and run regression | Slope, intercept, or predicted value |
| Unknown constant in answer choices | Test choices with a slider or substitution | The choice that makes the condition true |
Fast workflows to practice
Practice one workflow at a time: type the setup, identify the requested input or output, then confirm it against the wording. Keep unfamiliar calculator entries in untimed practice before using them in a module.
A good Desmos shortcut has three parts: what to type, what value to read, and how to translate that value back into the answer format.
- Systems: enter each side as its own equation, click the intersection, then check whether the question asks for x, y, x + y, or a parameter.
- Tables: after typing a function, use the table to test several inputs quickly instead of recomputing the expression by hand.
- Quadratics: graph first when the problem asks for roots, the number of solutions, or a maximum/minimum; use algebra first when the expression already factors cleanly.
- Regression: enter the data points and choose the model named in the question. A prediction outside the observed data is extrapolation; keep that distinction when interpreting the answer.
- Answer-choice testing: substitute a candidate while preserving signs and units. Check every stated condition before accepting it; an ordered-answer search helps only when the relationship is monotonic.
Shortcut syntax
Type ^ for an exponent, / for a fraction and _ for a subscript such as . A custom regression uses ~ instead of =; on a U.S. keyboard, type Shift with the backtick key. Keyboard layouts differ, so rehearse on your test device. Use the Desmos Trainer for repeated entry practice.
| Goal | Type this | Use it for |
|---|---|---|
| Find a solution | y = left side and y = right side | Equations, systems, and answer choices with an equality condition |
| Evaluate a function | f(x) = expression, then table | f(3), f(a), repeated substitutions, and function tables |
| Find roots | y = expression | Quadratic, polynomial, radical, or rational equations |
| Test a parameter | Use a letter such as a, then add slider | Unknown constants, coefficients, and shift/stretch questions |
| Fit a line | Scatterplots with a linear model or line of best fit | |
| Fit a quadratic | Data tables that clearly curve and ask for a quadratic model | |
| Focus a domain | expression {lower < x < upper} | Piecewise, interval, and graph-window questions |
Example moves
If a system asks for the value of x + y, do not stop at the intersection. Graph the two equations, read the point, then add the coordinates.
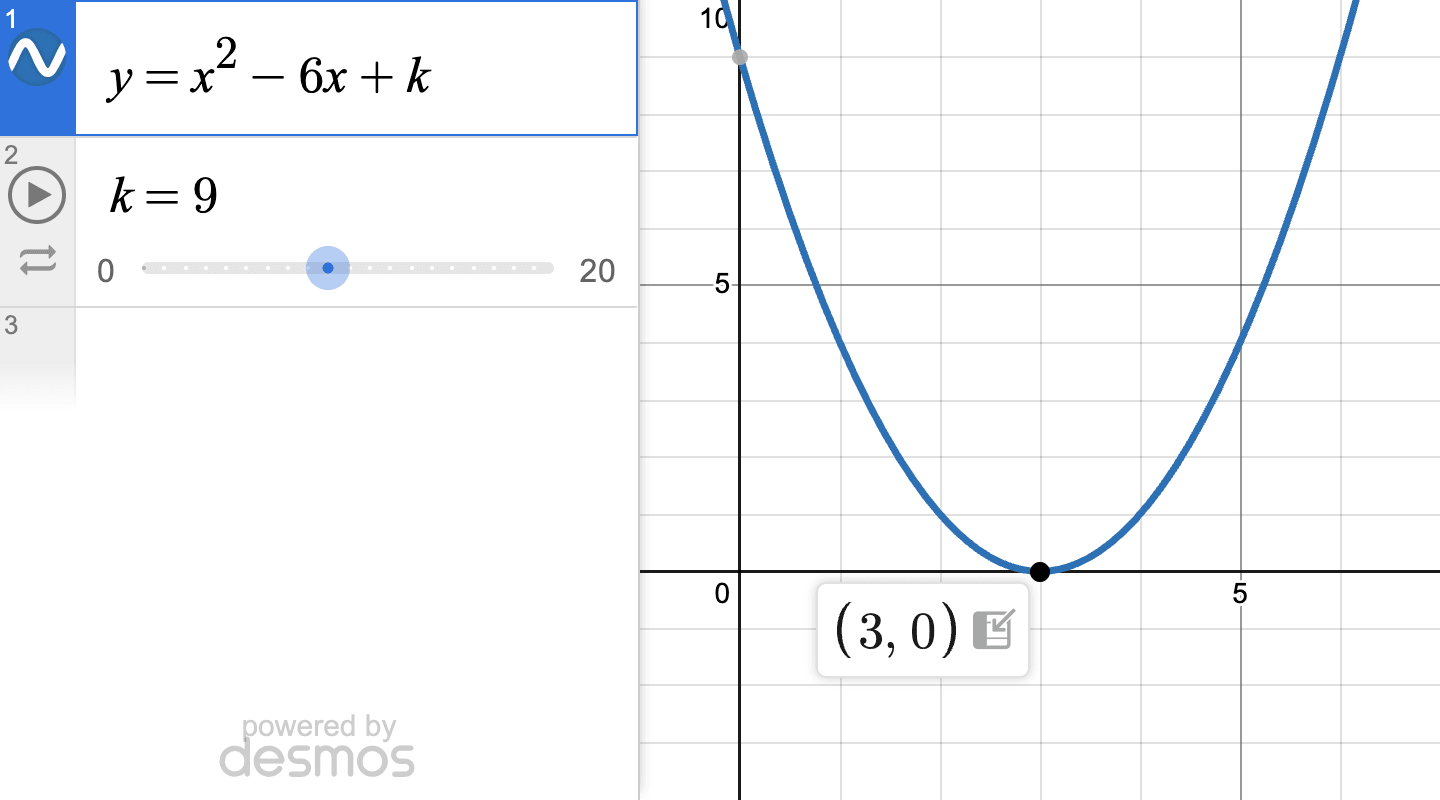
If a quadratic asks how many real solutions it has, graph y = expression and count x-intercepts. If the graph only touches the x-axis once, that is one real solution.
If a scatterplot asks for a predicted value, use regression to get the model, then substitute the requested x-value. Do not extrapolate unless the question explicitly asks you to use the model outside the data range.
Common Desmos mistakes
Check the translation, not just the calculator: label variables before typing, and confirm that the value you read is the quantity the question asks for.
- Reading the y-coordinate when the question asks for x.
- Forgetting that an intersection may need to be rounded, rewritten as a fraction, or plugged into another expression.
- Using regression on a question that only needs slope from two points.
- Trusting a graph window without zooming or using the table to confirm the value.
- Typing answer choices without preserving units, percent form, or negative signs.
Best question types
Desmos is strongest for functions, systems, nonlinear equations, and data modeling. It is also useful as a final check on algebra when the problem gives answer choices.
Desmos's College Board configuration sheet lists two changes to the SAT's graphing calculator: images, folders, and notes are turned off, and Log mode is checked automatically for applicable exponential, logarithmic, and power regressions. The moves on this page don't depend on either.
Bluebook lets you switch between the graphing and scientific calculators, but anything typed in one doesn't carry over to the other, so check which one is open before you type.
Nonlinear Functions · Easy
What is the minimum value of the given function?
Choose an answer.
Try it yourself
Choose an answer.
Sources
- Desmos regression syntax and templates
- Desmos keyboard shortcuts
- Desmos College Board testing configuration
- College Board calculator policy
- Graph reuse license (CC BY-SA 4.0)
Desmos and related trademarks are property of Desmos Studio PBC.
Next steps
FAQs
What is the best Desmos shortcut for SAT Math?
Graphing both sides of an equation and finding intersections is the most broadly useful shortcut.
Should I use Desmos on every Math question?
No. Use it when it saves time or reduces error risk.
Related SAT resources
- SAT Desmos Reference Sheet
Download the SAT Desmos reference sheet and practice worked intersection, function, root and regression setups with clear answer checks.
- SAT Calculator Policy Chart
SAT calculator policy chart explaining Desmos access, personal calculators, and when to use calculator-first math strategies.
- SAT Quadratic Functions Worksheet
Free printable SAT quadratic functions worksheet: 12 questions on vertices, roots, intercepts, and quadratic models, with worked solutions.